
1. Executive Summary
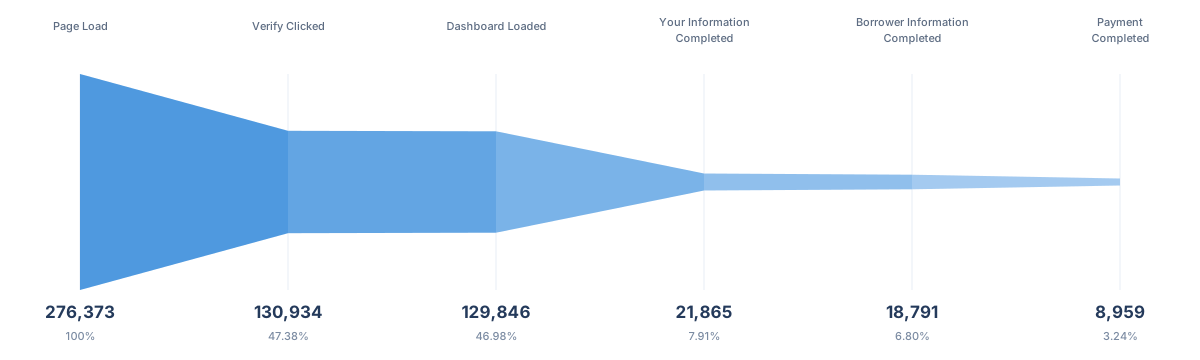
Overall funnel conversion is 3.24% (8,959 out of 276,373). This means that 267,414 users do not reach the final event.
After the Dashboard opens, conversion is 6.9% (8,959). This means that 120,887 users do not reach the final event.
Overall Conversion — 3.24%
| Page Load | Dashboard Loaded | Payment Completed | Conversion | Lost users | Drop-off |
|---|---|---|---|---|---|
| 276,373 | 129,846 | 8,959 | 3.24% | 267,414 | 96.76% |
Dashboard → Payment
| Started | Completed | Conversion | Lost Users | Drop-off |
|---|---|---|---|---|
| 129,846 | 8,959 | 6.90% | 120,887 | 93.10% |
Key observations:
- 83.16% of users do not reach
Your Information Completedafter opening the Dashboard. - 52.32% of users do not complete payment after
Borrower Information Completed. - The event sequence in analytics does not match the order of sections in the interface.
- The available data does not reveal the exact reasons for abandonment.
Preliminary areas to prioritize
- The Dashboard page.
- The payment process.
The financial modeling below helps estimate the potential scale of improvements; it does not calculate actual lost revenue.
2. Current Funnel Performance
| Stage | Users | Conversion | Drop-off | Lost users |
|---|---|---|---|---|
| Page Load | 276,373 | 100% | — | — |
| Verify Button Clicked | 130,934 | 47.38% | 52.62% | 145,439 |
| Dashboard Loaded | 129,846 | 99.17% | 0.83% | 1,088 |
| Your Information Completed | 21,865 | 16.84% | 83.16% | 107,981 |
| Borrower Information Completed | 18,791 | 85.94% | 14.06% | 3,074 |
| Verification Payment Completed | 8,959 | 47.68% | 52.32% | 9,832 |
Conversion and drop-off are calculated relative to the previous stage.
Initial findings
- Dashboard → Your Information has the largest relative drop-off within the product (83.16%).
- Borrower Information → Payment shows substantial losses immediately before the final event (52.32%).
- Page Load → Verify has the largest absolute loss (145,439 users), but visitors’ intentions are unknown.
- Verify → Dashboard has minimal losses (0.83%), suggesting a relatively reliable transition between pages.
These metrics identify problematic parts of the journey, but do not explain why users abandon it.
3. Analytics Limitations
3.1. The event sequence does not match the interface
In analytics:
- →
- Verification →
- Dashboard →
- Your Information →
- Borrower Information →
- Payment
In the interface:
- →
- Verification →
- Dashboard →
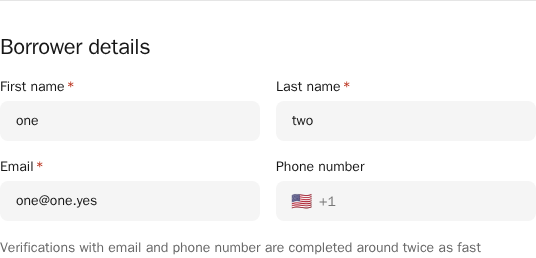
- Borrower Details →
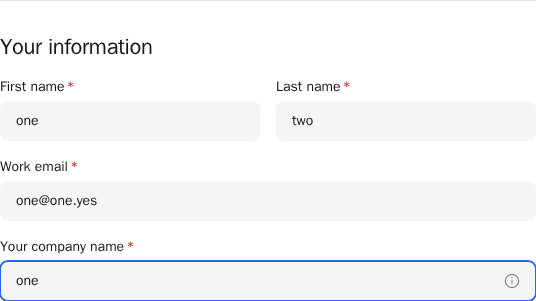
- Your Information →
- Continue →
- Payment form →
- Payment
The sections are available on a single page and can be completed in any order.
For example, a user may finish Borrower Details and then leave without completing Your Information.
Why this matters
That user would be counted as a loss between Dashboard and Your Information, even though they may have stopped elsewhere in the form.
Similarly, the 85.94% conversion between Your Information and Borrower Information does not prove that the latter section is easier to complete.
Conclusion
Validate event definitions, the order in which events are recorded, and the funnel construction rules. Until then, losses within individual sections cannot be assessed reliably.
3.2. Events are not granular enough
The current funnel shows completion of major stages, but does not capture interactions within the form.
What we do not know
- Whether users start filling out the form.
- Which fields cause difficulties.
- How many required fields are completed before users leave.
- Whether validation errors occur.
- How many users click Continue.
- How many users open and close the payment form.
- Which payment fields produce errors.
- Where users stop filling out the payment form before closing it.
- How many payment attempts fail.
Conclusion
The current analytics can support an assessment of overall conversion, but are insufficient for identifying specific UX problems.
4. UX Findings & Hypotheses
4.1. Dashboard: 83.16% Drop-off
Data
- Dashboard Loaded: 129,846 →
- Your Information Completed: 21,865.
| From | To | Conversion | Lost Users | Drop-off |
|---|---|---|---|---|
| 129,846 | 21,865 | 16.84% | 107,981 | 83.16% |
Possible causes
- Users do not start filling out the form.
- Users encounter difficulties in Borrower Details.
- Users do not notice Your Information because it is below the fold.
- Users start but do not finish the required fields.
- Validation errors prevent form completion.
Additional UX observation
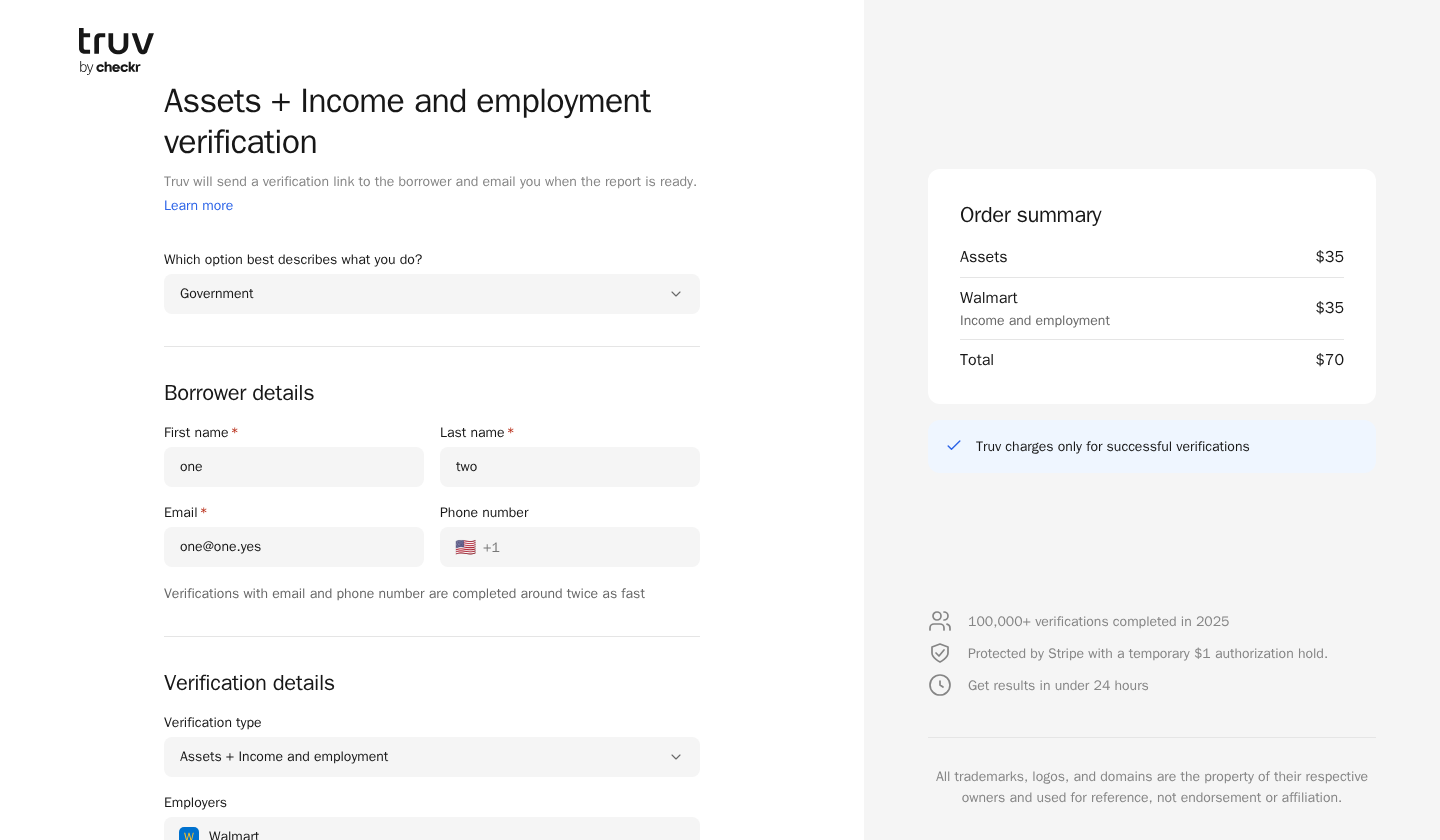
At a browser height of 840 px, Your Information and Continue are below the fold.
The form does not show an explicit progress indicator. Continue remains disabled until all required fields are complete.
This may make it harder to understand the total amount of work and the requirements for proceeding to payment.
Conclusions
- 83.16% is the share of users who do not reach Your Information Completed, not a proven abandonment rate within that section.
- Identify actual exit points and test hypotheses about form length, section visibility, and input errors.
4.2. Payment: 52.32% Drop-off
Data
- Borrower Information Completed: 18,791 →
- Verification Payment Completed: 8,959.
| From | To | Conversion | Lost Users | Drop-off |
|---|---|---|---|---|
| 18,791 | 8,959 | 47.68% | 9,832 | 52.32% |
Possible causes of abandonment
- Users have not completed all required fields.
- Users do not click Continue.
- Users close the payment modal.
- Users decide against purchasing because of the price.
- Users encounter input or payment-processing errors.
Conclusions
- The current funnel combines form completion, the transition to payment, and payment processing itself.
- It cannot establish whether drop-off is caused by the interface, the price, or payment errors.
4.3. Landing Page: 52.62% Drop-off
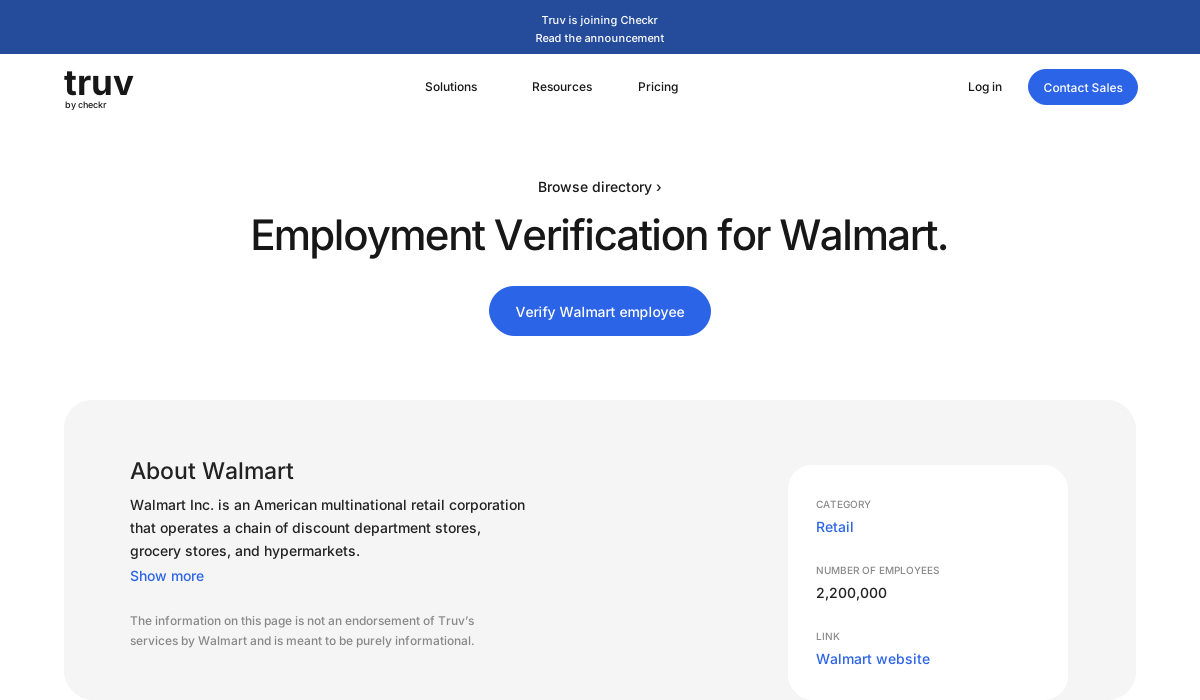
Data
- Page Load: 276,373.
- Verify Button Clicked: 130,934.
- Loss: 145,439 users (52.62%).
| From | To | Conversion | Lost Users | Drop-off |
|---|---|---|---|---|
| 276,373 | 130,934 | 47.38% | 145,439 | 52.62% |
Possible causes of abandonment
- Some users are looking for information rather than planning to order a verification.
- Some users arrive on the page accidentally.
- Some users are not relevant to the target action.
- Pricing or the next steps may be unclear.
- The service’s value may not match some visitors’ expectations.
- The CTA may not match the user’s intent.
Conclusion
This is the largest loss in absolute terms, but is not necessarily a UX problem. First segment the traffic and establish who is arriving on the page.